🕑Reading time: 2min
🔥We cut our monthly supermarket spending by 5%
My girlfriend Gabby and I analyzed our October receipts to cut down on the products we buy. We expected to save 8% ($28) every month on our supermarket spending category by doing this:
- Replace cardboard juices with natural juices we prepare during meal prep.
- Buy less bread & replace with wheat tortillas.
- Replace drinking chocolate with Nesquik.
In November we already saved at least 5% ($18). We'll keep monitoring.
🎯WHY THIS MATTERS: We are saving money to fund our biggest 2026 expenses:
Bringing our parents to visit us in Buenos Aires.
- Going to several concerts: Ed Sheeran's, Coldplay's, etc.
- Going in a trip to Brazil in December.
🛒WHY THIS CATEGORY: We spend USD 331.52 ± 51.27/month on this category, making it our second-highest expense after rent, and the first one we can control.
My YNAB's spending trends report from the Needs category group, which includes our shared expenses like rent (yellow) and supermarket (burgundy):
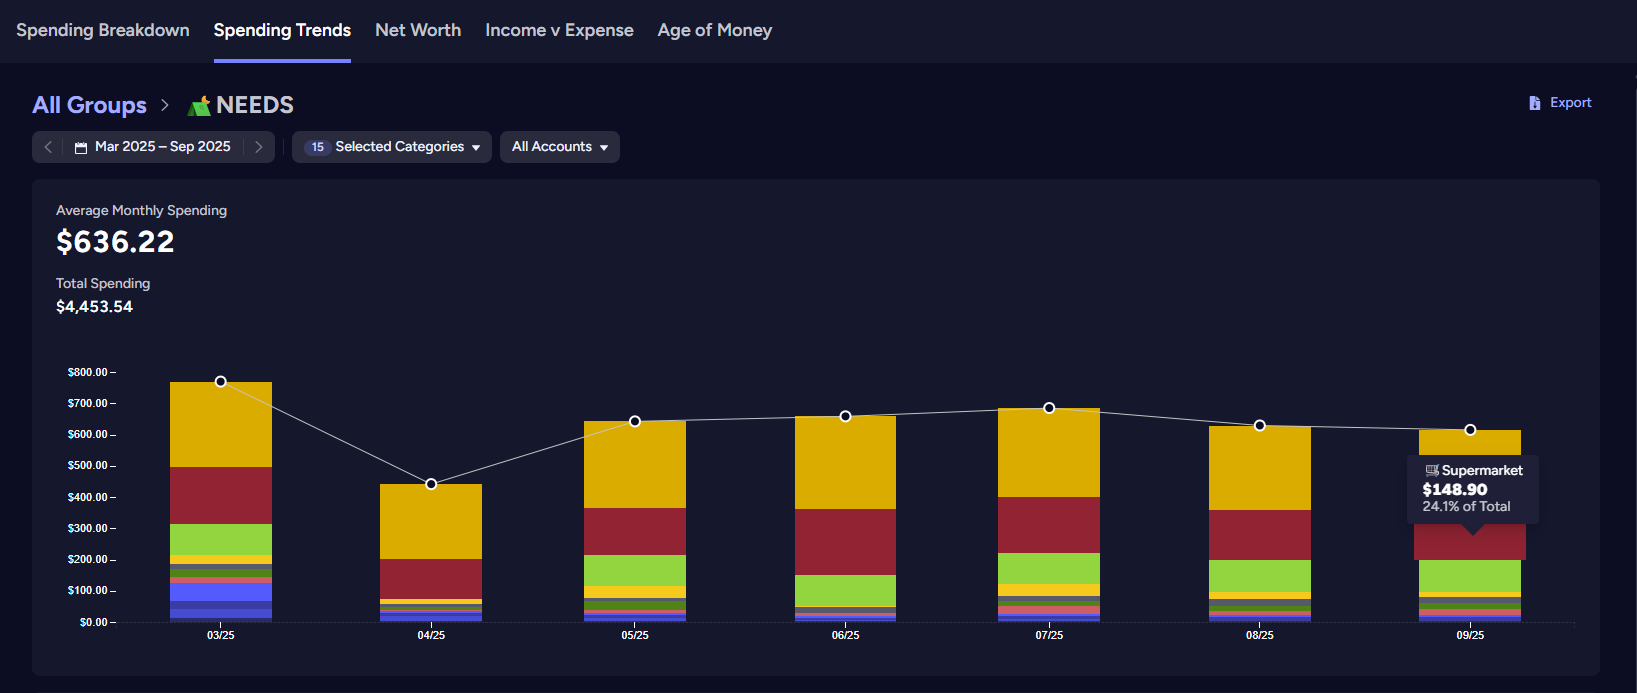
- We split our shared expenses 50-50. This image only shows my half.
- Aggregated data from both of our YNAB accounts:

- The supermarket category includes groceries, cleaning products & personal hygiene items.
🧠WHAT WE DID: We analyzed our supermarket receipts from October and made decision to spend less in some products.
- Decisions:
We considered all the potential cost cutting decisions:
- Switch brands or supermarket.
- Buy less of a product.
- Stop buying a product.
- Use different payment methods to access discounts.
The spending for this category happens at a butcher, a deli, a greengrocer, and a supermarket (named Coto).
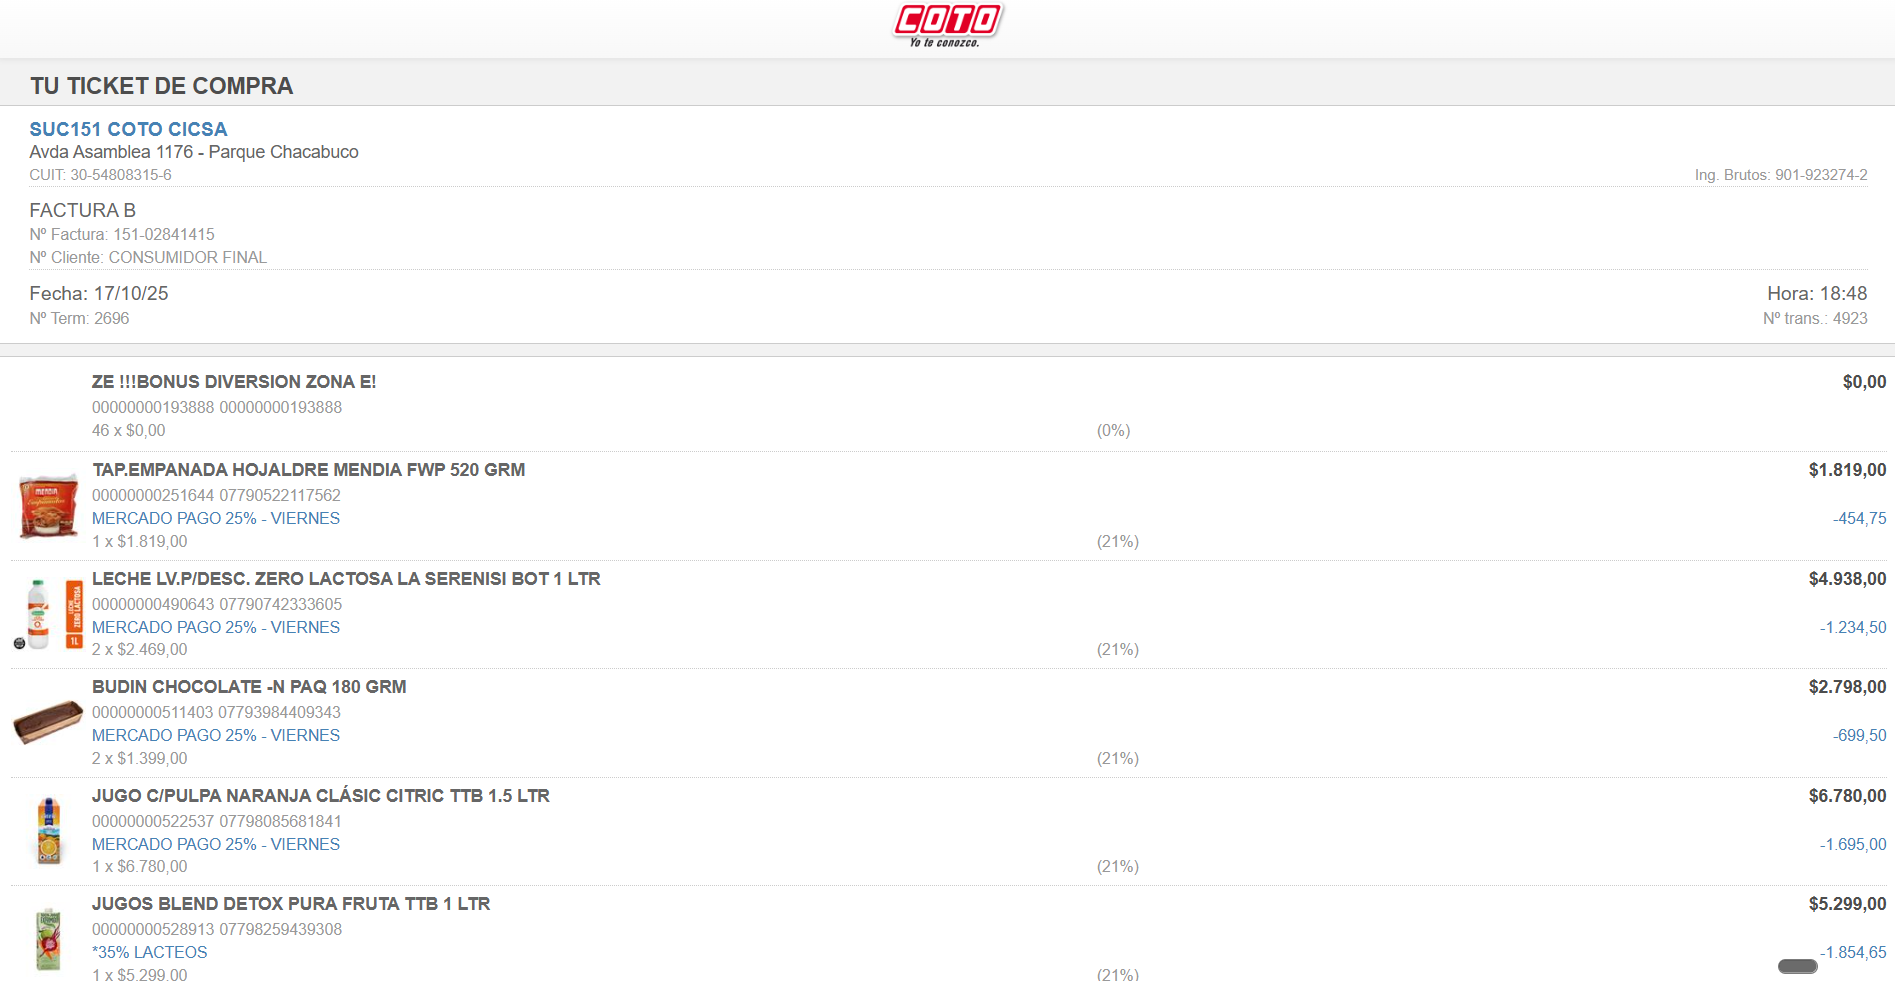
Only Coto gives us an itemized receipt that lets us analyze every product, and luckily, it includes a QR code linking to a digital version of the receipt. Example:
Product | Decision | Estimated Monthly Saving |
|---|---|---|
Cardboard Juices | Replace cardboard juices with natural juices we prepare during meal prep. | USD 15 |
Bread | Buy less & replace with wheat tortillas. | USD 10 |
Drinking Chocolate | Stop buying it & switch to Nesquik. | USD 3 |
Total: % over average spending (USD 331.52): | USD 28 8% |
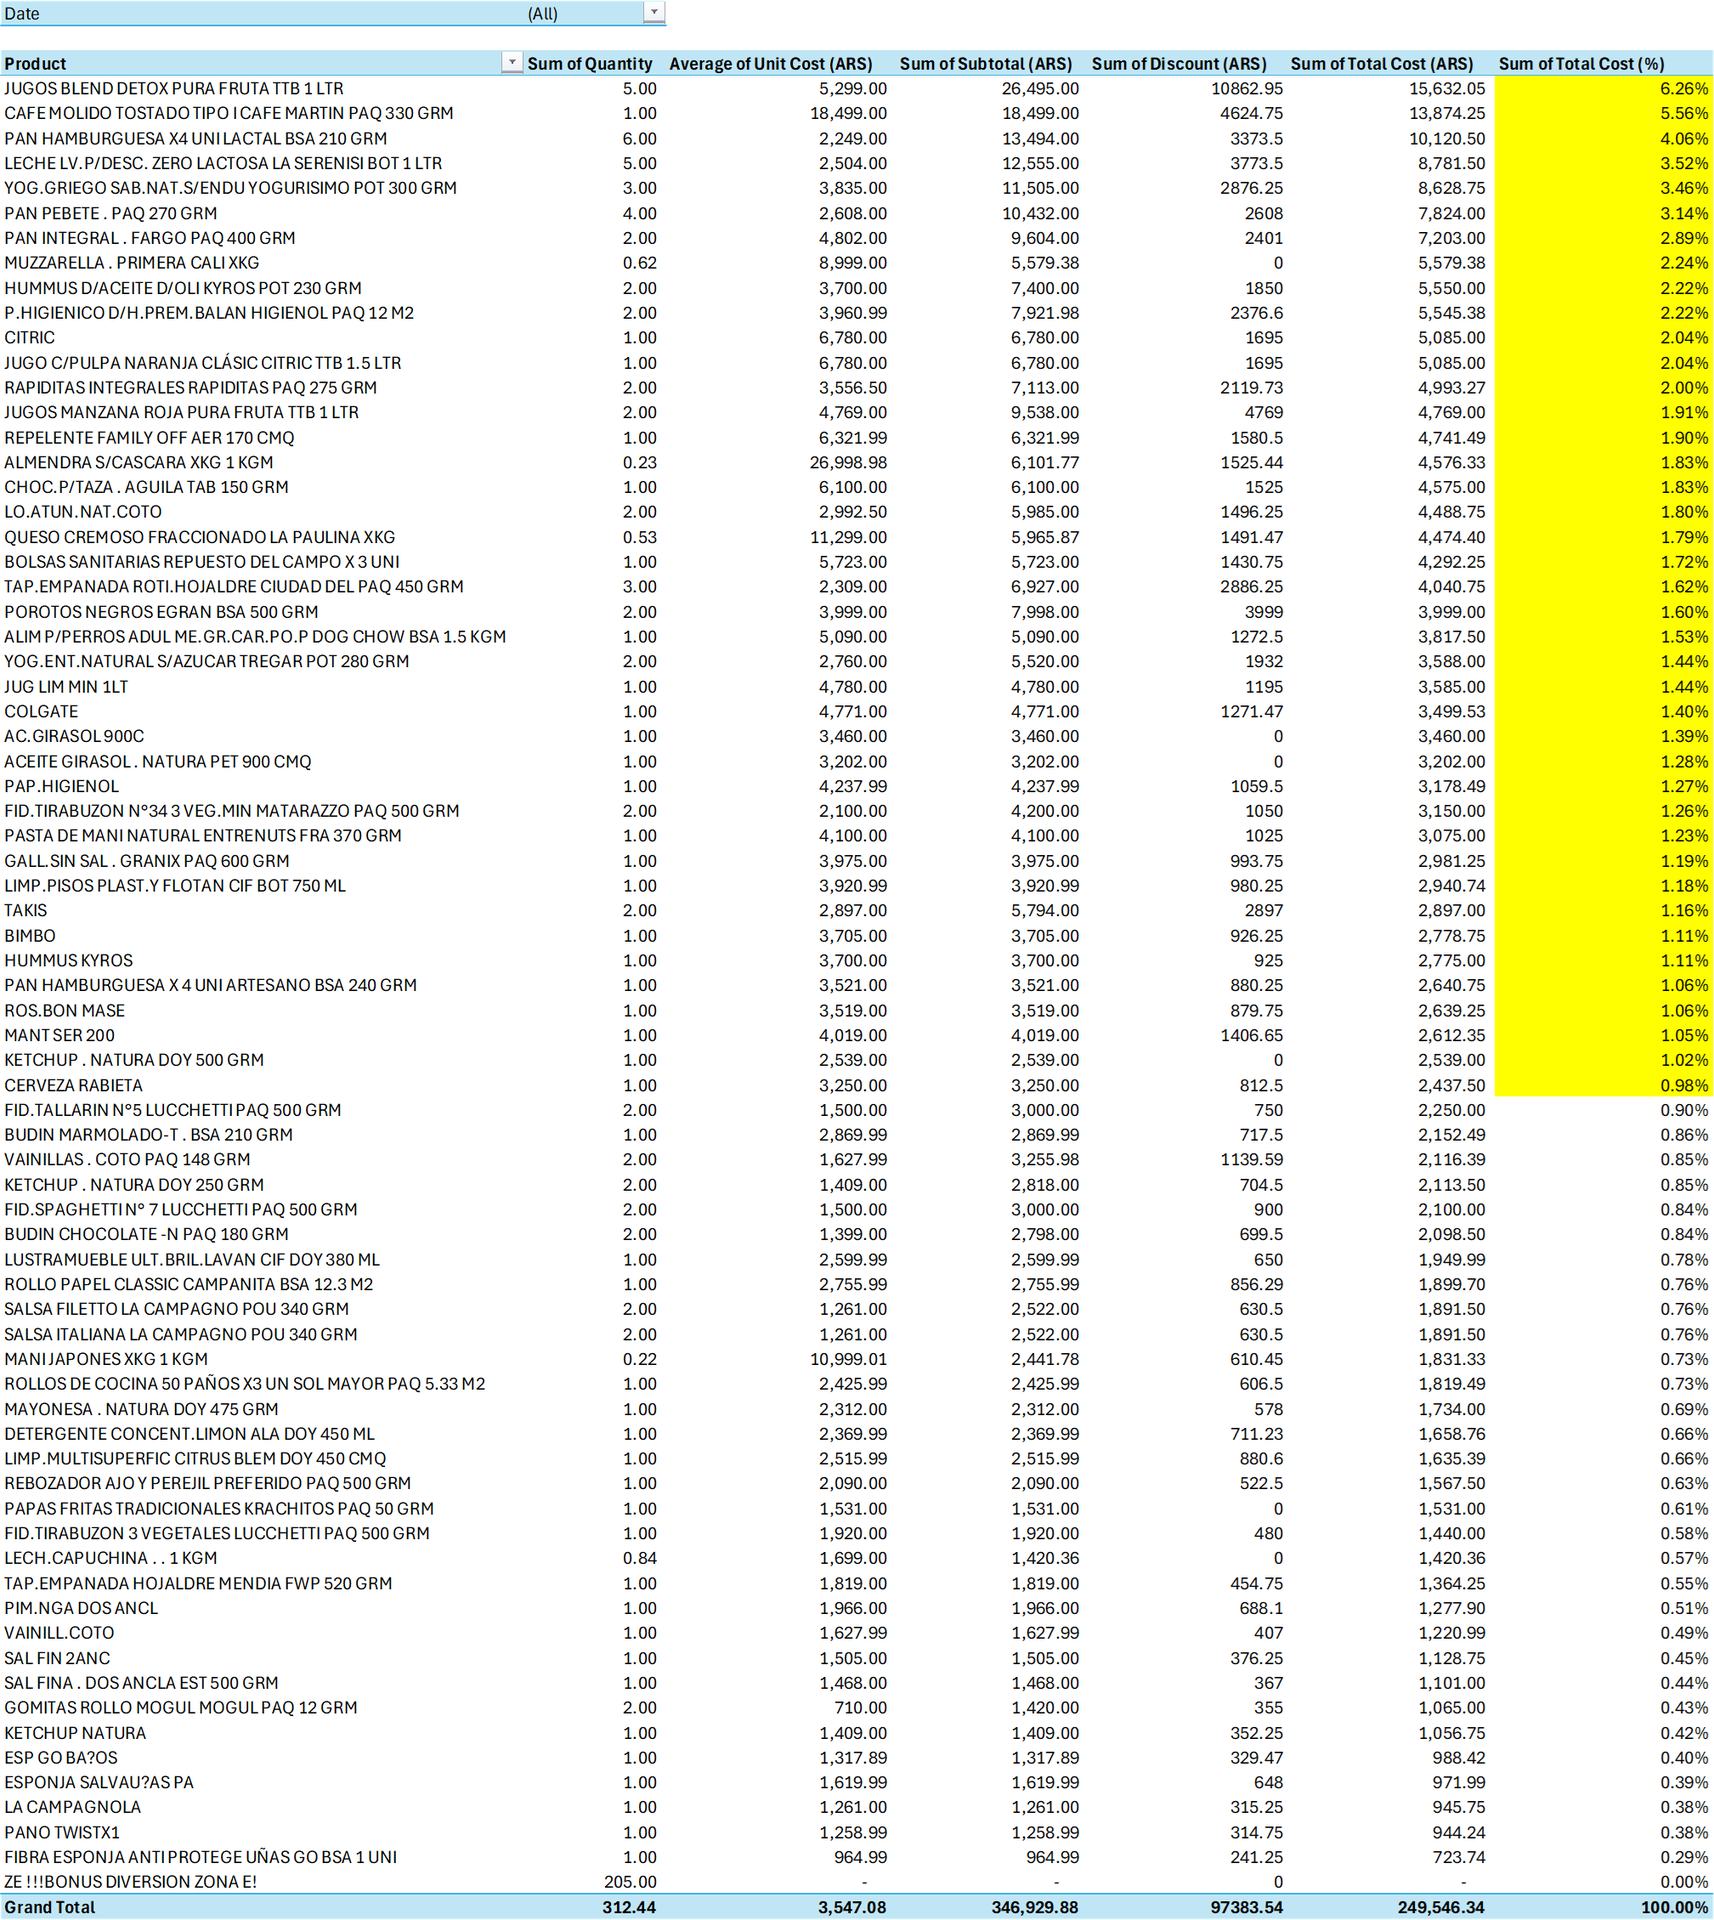
- I built a tool in Excel that extracts the data from the digital receipt using Power Query, cleans it, and transforms it in a table ready for analysis:
- Download Coto Receipt Data Extractor
- We analyzed the clean data from all October invoices using Excel's pivot tables, focusing on the products that make up 80% of our spending (the pareto, in yellow), and came up with the decisions.
💪🏻WHAT WE HAVE ACCOMPLISHED: On November we spent $268.2 on the supermarket category, 5% less than the lower limit of the interval around the average of what we spend every month (USD 331.52 ± 51.27/month).